

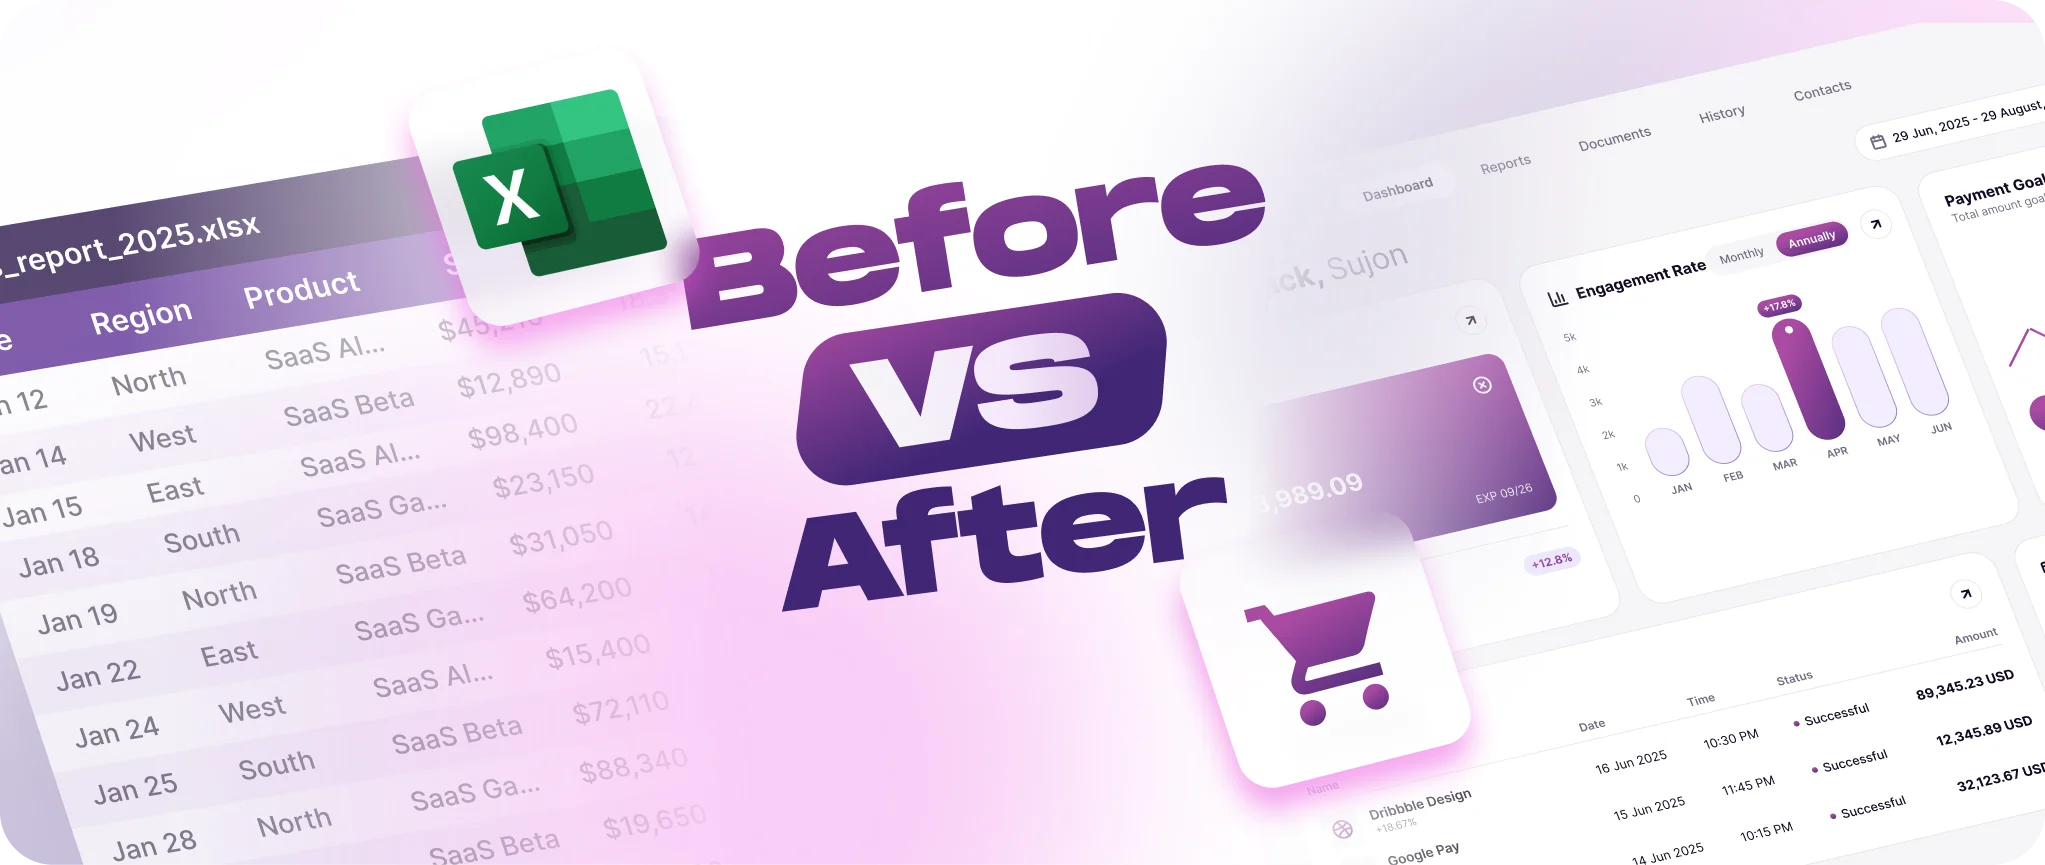
For years, Excel has been one of the most vital tools for organizing company information. It would be unfair to talk about digital transformation as if spreadsheets were the problem. In many businesses, they remain useful, flexible, and familiar to teams. The goal isn’t to abandon Excel just to follow a trend, but to recognize when it stops being enough to understand what is truly happening in your business.
That realization usually arrives quietly. First comes a shared spreadsheet with too many versions. Then, a report that relies on a single key person. Later, different departments start working with conflicting numbers for the exact same process. Sales reports one figure, operations has another, finance works off a different cutoff date, and leadership receives a summary that arrives too late. The company has data, but it lacks clarity.
The New Standard in Business Data Management
This gap is becoming increasingly critical. Research into enterprise data trends highlights that organizations are shifting toward unified data platforms—placing greater emphasis on governance, data accuracy, and reliable decision-making. The conversation is no longer just about generating reports, but about ensuring that data has context, a shared definition, and real strategic utility.
A dashboard shouldn’t be viewed merely as a prettier version of a spreadsheet. Its real value lies in organizing critical business questions: How are sales performing? Where are the operational bottlenecks? Which processes generate the most issues? Which team needs attention? What changed compared to last week? When a dashboard is well-designed, it doesn’t try to show everything; it helps you focus on what matters with less noise.
Industry analysts consistently emphasize a similar point: the future of enterprise data consumption won’t rely on a single format. Reports, visual analytics, self-service tools, alerts, and embedded workflows will all continue to coexist. The key factor is having a unified single source of truth—allowing teams to trust the information without rebuilding data from scratch every time a decision needs to be made.
Signs Your Company Needs a Business Control Dashboard
One of the clearest signs that a company needs to move from isolated Excel sheets to an integrated dashboard is when teams spend more time preparing data than analyzing it. If every meeting starts with a debate over which file is the correct version, if reports require manual updates, or if decisions depend on copying and pasting data between disparate systems, the problem isn’t just operational—it is a visibility problem.
In enterprise software projects, this situation happens frequently. It isn’t because teams lack capability, but because operations grow faster than tracking tools can handle. Dofleini addresses these needs through specialized services in system integration, business intelligence, reporting, and custom control dashboards. The logic is simple: before asking teams for more effort, evaluate whether information is flowing properly between the systems your business already uses.
Key Capabilities for Real-Time Decision-Making
Making the transition doesn’t have to be drastic. Many organizations can start by identifying a single critical process and a specific question. For example: How long does a service request take to resolve? Which products drive the most support queries? Where are sales opportunities dropping off? Or which part of operations holds the most manual overhead? From there, a dashboard helps convert scattered data points into a clear, shared reality.
Modern studies on high-performing organizations highlight key capabilities for real-time decision-making: seamless data availability, empowered employees, business agility, and an integrated customer experience. While not every company needs real-time operations on day one, everyone can learn from the core principle: making better decisions requires getting timely, meaningful insights.
Moving from Excel to a dashboard doesn’t mean dismissing what worked in the past. It means accepting that, at a certain stage, your company needs to look at its data differently. A spreadsheet organizes information; a great dashboard helps you understand it, share it, and act on time.
The true leap isn’t just changing tools. It’s stopping the chase for loose files and building a clearer vision of your entire operation.
Is your team spending more time compiling reports than making strategic decisions? The next step might not be another spreadsheet, but a better way to look at your business data. Contact Dofleini today to discover how to unlock custom business intelligence for your company.